At the end of Term 1, I have learnt about many new concepts and topics. However, along the way, I also faced difficulties in understanding these things, or applying them.
For example, the drawing of graphs was new to me. We had to rescale the graph and start form a number besides 0. However, I was unable to do this at first I and did it the primary school method - starting from 0. Then, after many, many worksheets in which we have to draw graphs, I finally got the gist of it and could draw, I would say, much better graphs than before.
Also, when we learnt about measuring instruments, I did not exactly understand how the negative zero error worked. For example, if the 0 on the vernier scale was to the left of the 0 on the main scale and the mark in line with the main scale on the vernier scale is 6, I thought that the zero error was -0.06cm, although it really was 0.04cm. However, after a bit of simple math (picturing the vernier scale moving to the left of the main scale and doing calculations), I understood the concept, although forgot it sometimes.
Some of the concepts I have learnt in Term 1 include the formula of density (mass/volume), how to find significant figures as well as do calculations, and also, the difference between a non-luminous falme and a luminous flame.
As for applying these concepts in the real world, we can find the mass of something if we know its volume and density. this helps in measuring a certain mass of water. If we want 100g of water, we know that 100ml of water is equivalent to a 100g of water, since water's density is 1. If we do not know this, we would have to measure a jar's mass, then fill the jar with water until it reaches 100g more than the mass of the jar/ Muich more complicated, is it not? Compared to just measuring 100ml of water, I think so.
Beyond our learning from notes and worksheets, we also learn from doing hands-on in the lab. For example, we learnt how to measure the period of a pendulum through one experiment where we had to, of course, measure the period of the pendulum. We also learnt how to use the bunsen burner safely and effectively, such that we can avoid strike backs as much as possible, and also learn how to react to a strike back. We also learnt about the switching from luminous to non-luminous flames, and when to use which (If we want extremely high temperatures, use the non-luminous flame. If we want slightly lower temperatures, use the luminous flame). Also, because we do experiments nearly every week, I familiarised myself with many of the lab apparatus and know most of their functions.
To summarise, Term 1 has been an enriching term, and the things I learnt definitely will help me to understand the things in Term 2 better than if I had not learnt them.
Saturday, 28 June 2014
Sugar Crystals
For the June Holidays, we were given an assignment - to create our own sugar crystals. This is the thing - we were not given any procedures, so this was completely independent learning and we had to do our own research. My first reaction when I saw this was "How do I even do this...". However, luckily, a quick search on Google (technology nowadays) let me find out about the process of creating these crystals. So... Let's get on to the procedures!
Apparatus:
Glass Jar
Pencil/Pen
String
Pan (to boil water)
A bag of sugar (around 500g maybe just in case)
Tap water/drinking water/as long as it isn't dirty water
Rock sugar (to weigh down the string as well as to have crystals growing on it).
Something to stir the solution (For me, chopsticks)
A spoon to add sugar into the solution with
Procedures:
1. Tie a string to a piece of rock sugar (crystals will grow on it afterwards).
2. Tie the string to someone somewhat-long (e.g. pencil, pen, stick).
3. Then, get a container (I used a glass jar) and place the pencil on the top such that the rock sugar does not touch the bottom of the jar.
4. Fill the glass jar with water twice, first fully, second fill it halfway, then pour the water both times into the pan.
5. Start heating up the water and wait for the water to start boiling.
6. Once the water starts boiling (bubbling), stop heating the water.
7. Keep adding sugar one spoon at a time while stirring until no more sugar dissolves (to have a saturated solution).
8. Then, pour the solution into the glass jar to about 3/4 full.
9. Wait a few days and observe the crystals growing (Joy!).
10. Oh wait, before running off to do other stuff, wash the pan, for goodness sake.
That's all! I failed the first time because I messed up the procedures then after trying it again I succeeded!
It was a fun experiment and I learnt some things from it. To be perfectly honest, I enjoy doing hands-on much more than worksheets, so it was nice that our teacher assigned this experiment to us! Oh and of course, I have to bring the crystals to school.
Apparatus:
Glass Jar
Pencil/Pen
String
Pan (to boil water)
A bag of sugar (around 500g maybe just in case)
Tap water/drinking water/as long as it isn't dirty water
Rock sugar (to weigh down the string as well as to have crystals growing on it).
Something to stir the solution (For me, chopsticks)
A spoon to add sugar into the solution with
Procedures:
1. Tie a string to a piece of rock sugar (crystals will grow on it afterwards).
2. Tie the string to someone somewhat-long (e.g. pencil, pen, stick).
3. Then, get a container (I used a glass jar) and place the pencil on the top such that the rock sugar does not touch the bottom of the jar.
4. Fill the glass jar with water twice, first fully, second fill it halfway, then pour the water both times into the pan.
5. Start heating up the water and wait for the water to start boiling.
6. Once the water starts boiling (bubbling), stop heating the water.
7. Keep adding sugar one spoon at a time while stirring until no more sugar dissolves (to have a saturated solution).
8. Then, pour the solution into the glass jar to about 3/4 full.
9. Wait a few days and observe the crystals growing (Joy!).
That's all! I failed the first time because I messed up the procedures then after trying it again I succeeded!
It was a fun experiment and I learnt some things from it. To be perfectly honest, I enjoy doing hands-on much more than worksheets, so it was nice that our teacher assigned this experiment to us! Oh and of course, I have to bring the crystals to school.
Wednesday, 18 June 2014
Term 1 Week 8
For this week, we went through accuracy and precision. We had a discussion about the difference between accuracy and precision, which was made clear to us eventually when our teacher showed us some powerpoint slides.


Accuracy VS Precision
To make it easier to understand, a target and darts analysis was used.
As shown in the picture, precision is basically consistency, or as the picture also says, reproducibility. Accuracy is, as the picture shows, how 'correct' the result is, or rather, how close the result is to the right value, in this case, the bull's eye.
Some examples of accuracy in measuring instruments:
Ruler - 0.1cm/1mm
Vernier Caliper - 0.01cm/0.1mm
Micrometer Screw Gauge - 0.001cm/0.01mm
These measuring instruments are accurate up to a different number of decimal places, the more decimal places, the closer the measurement is to the exact length of the object being measured.
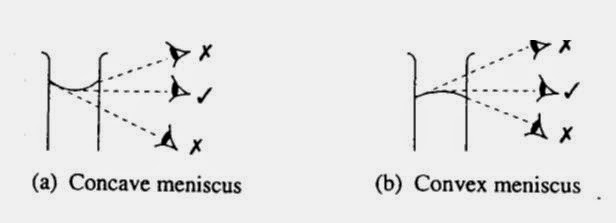
We also learnt how to read the meniscus of liquids. There are two types of menisci - concave and convex. This picture shows how to read each:
Then, we learnt about estimating the area of irregular things. For example:
Firstly, divide the figure into small squares like this:
To estimate the area, look at the parts of the figure in the squares. If a square is half or more than half occupied, count the square as part of the figure's area. If this is not the case, the square is not counted.
After counting x squares, multiply the area of each square by x to get the estimated area of the figure.
The smaller the squares used, the more accurate the estimation is.
For measuring time, we use stopwatches. There are yet again, two types of stopwatches - analogue and digital. The analogue stopwatch measures to an accuracy of 0.1s, while the digital measures up to 0.01s, so clearly, the digital is more accurate than the analogue stopwatch. However, because of our human reaction error, the second decimal place when using a digital stopwatch is not counted, so an analogue stopwatch is just as useful as the digital.
Another way of measuring time is the ticker-tape timer. As shown in the picture below:
The distance between every two dots is the movement made in 0.02s, so since there are 10 dots after the first in the picture, a total of 0.2s has elapsed (Just imagine using this to time 20s, 1000 dots, how fun counting).
The time for a pendulum to make an oscillation is called the period. An oscillation is counted when the pendulum passes the fudicial line after passing it before. Basically, it's the time taken for a whole swing from left to right.
The end of this term has come (lessons at least).
SEE YOU AND HAVE FUN
Tuesday, 17 June 2014
Term 1 Week 7
This week we learnt about some measuring instruments - calipers, vernier calipers, and the micrometer screw gauge.
Firstly, what are calipers? There are two types of calipers - external and internal. The calipers are used to measure the inside and outside diameters of round objects. So... this is a picture of an external caliper.
 To use the external caliper, move the jaws of the caliper such that that touch the outer surface of the round object. Then, remove the caliper from the object and measure the distance between the jaws with a ruler. That is the outer diameter of the object.
Now, this is a picture of an internal caliper.
 The internal caliper is used to measure the internal diameter of a hollow round object (such as a pipe). To use this, move the jaws such that they touch the inner surface of the object. Then, again, remove the caliper from the object and measure the distance between the jaws with a ruler.
Now, what are vernier calipers? Vernier calipers are a type of measuring instrument which is accurate up to 0.01cm. However, rulers are only accurate up to 0.1cm, or 1mm. This is a picture of the vernier caliper.

The outside jaws are used to measure the external diameter of objects, while the inside jaws are, of course, to measure the internal diameter of round objects. Firstly, let's talk about how we measure the external diameter of objects. To measure the external diameter of objects, move the vernier scale such that the outside jaws touch the external surface of the object. Then, look at the vernier scale. The mark on the main scale that is to the left of or on the '0' on the vernier scale would be the diameter of the object up to 0.1cm. Then, check the vernier scale again. Check for the mark on the main scale which is directly on the mark on the vernier scale. For example, if the mark on the vernier scale which is directly below the mark on the main scale is '5', add 0.05cm to the measurement you got before this (the mark on the main scale to the left of the '0' on the vernier scale). If the mark on the vernier scale which is directly below the mark on the main scale is zero, take the mark on the main scale and add nothing. For the internal diameter, the only different step is that the inside jaws should touch the internal surface of the object.
However, there is more to the vernier caliper. Before we start any of the measurements, we have to check for a 'zero error'. Firstly, close the outside jaws such that they touch each other. If the main scale's '0' is in line with the vernier scale's '0', there is no zero error. However, if the vernier scale zero is not in line, there is a problem.
So, there are 2 types of zero error - positive and negative. Firstly, let's talk about the positive zero error. If the vernier scale's '0' is to the right of the main scale's zero, the zero error is positive. to measure the zero error, take the mark on the vernier scale which is in line with the mark on the main scale. So, if the mark on the vernier scale in line is '3', we deduct 0.03cm off the measurements with the vernier caliper.
For negative zero errors, the '0' on the vernier scale is to the left of the '0' on the main scale. To find out the negative zero error, check the mark on the vernier scale in line with the mark on the main scale. If the mark on the vernier scale in line is '7', take (0cm - (0.1cm - 0.07cm)) = -0.03cm. For future measurements with this vernier caliper, take away -0.03cm, or rather, add 0.03cm to the measurements.
Now, for the micrometer screw gauge. The micrometer screw gauge measures the length of objects up to an accuracy of 0.01mm. Note that the vernier caliper only measures up to 0.01cm, or 0.1mm. However, this is slightly harder to explain in words so I'll show a video instead.
However, the video does not explain on the zero error so I will do that instead. When the micrometer screw gauge is close, check if the '0' on the thimble scale is aligned to the line. If they are not, then there is a zero error. For the positive zero error, check the mark on the thimble scale which is aligned. If the mark is 5, for future measurements, deduct 0.05mm from the measurements.
For the negative zero error, the '0' is above the line. Check the mark on the thimble scale which is aligned to the line. If the mark is 46, the zero error is (0mm - (0.50mm - 0.46mm) = -0.04mm. For future readings with this micrometer screw gauge, deduct -0.04mm, or add 0.04mm, to the measurements.
Firstly, what are calipers? There are two types of calipers - external and internal. The calipers are used to measure the inside and outside diameters of round objects. So... this is a picture of an external caliper.
Now, this is a picture of an internal caliper.
Now, what are vernier calipers? Vernier calipers are a type of measuring instrument which is accurate up to 0.01cm. However, rulers are only accurate up to 0.1cm, or 1mm. This is a picture of the vernier caliper.
The outside jaws are used to measure the external diameter of objects, while the inside jaws are, of course, to measure the internal diameter of round objects. Firstly, let's talk about how we measure the external diameter of objects. To measure the external diameter of objects, move the vernier scale such that the outside jaws touch the external surface of the object. Then, look at the vernier scale. The mark on the main scale that is to the left of or on the '0' on the vernier scale would be the diameter of the object up to 0.1cm. Then, check the vernier scale again. Check for the mark on the main scale which is directly on the mark on the vernier scale. For example, if the mark on the vernier scale which is directly below the mark on the main scale is '5', add 0.05cm to the measurement you got before this (the mark on the main scale to the left of the '0' on the vernier scale). If the mark on the vernier scale which is directly below the mark on the main scale is zero, take the mark on the main scale and add nothing. For the internal diameter, the only different step is that the inside jaws should touch the internal surface of the object.
However, there is more to the vernier caliper. Before we start any of the measurements, we have to check for a 'zero error'. Firstly, close the outside jaws such that they touch each other. If the main scale's '0' is in line with the vernier scale's '0', there is no zero error. However, if the vernier scale zero is not in line, there is a problem.
So, there are 2 types of zero error - positive and negative. Firstly, let's talk about the positive zero error. If the vernier scale's '0' is to the right of the main scale's zero, the zero error is positive. to measure the zero error, take the mark on the vernier scale which is in line with the mark on the main scale. So, if the mark on the vernier scale in line is '3', we deduct 0.03cm off the measurements with the vernier caliper.
For negative zero errors, the '0' on the vernier scale is to the left of the '0' on the main scale. To find out the negative zero error, check the mark on the vernier scale in line with the mark on the main scale. If the mark on the vernier scale in line is '7', take (0cm - (0.1cm - 0.07cm)) = -0.03cm. For future measurements with this vernier caliper, take away -0.03cm, or rather, add 0.03cm to the measurements.
Now, for the micrometer screw gauge. The micrometer screw gauge measures the length of objects up to an accuracy of 0.01mm. Note that the vernier caliper only measures up to 0.01cm, or 0.1mm. However, this is slightly harder to explain in words so I'll show a video instead.
However, the video does not explain on the zero error so I will do that instead. When the micrometer screw gauge is close, check if the '0' on the thimble scale is aligned to the line. If they are not, then there is a zero error. For the positive zero error, check the mark on the thimble scale which is aligned. If the mark is 5, for future measurements, deduct 0.05mm from the measurements.
For the negative zero error, the '0' is above the line. Check the mark on the thimble scale which is aligned to the line. If the mark is 46, the zero error is (0mm - (0.50mm - 0.46mm) = -0.04mm. For future readings with this micrometer screw gauge, deduct -0.04mm, or add 0.04mm, to the measurements.
Monday, 16 June 2014
Term 1 Week 6
Monday
In the previous week, we learnt about the different units of measurement for physical quantities. This week, we learnt about the prefixes for them, which determine the magnitude of the unit. For example, the prefix for kg, kilogram, is kilo. We also learnt what these units stand for. For example, g, gram, on its own, has no prefix. However, 1kg is equivalent to 1000g, so the prefix kilo stands for 10 to the power of 3, a thousand, or in short, 10^3. We learnt more prefixes such as mega (M), giga (G), tera (T), which are 10^6, 10^9, and 10^12 respectively. As for the prefixes which make a unit smaller than the unit without a prefix, they are deci (d), centi (c), milli (m, not capitalised), micro (µ), nano (n), and pico (p). These are 10^-1, 10^-2, 10^-3, 10^-6, 10^-9 and 10^-12 respectively. As you may have noticed, these units are all powers of ten, which makes conversion between them much easier than if otherwise.
We also learnt conversion between units with different prefixes.
For example,
497µm
= (497*10^-6)m
= 0.000497m
74m^2
= (74*10^2*110^2)cm^2
= 740000cm^2
Wednesday
Before we started off the lab lesson, we learnt about significant figures. As we all know, numbers have digits, and the number of significant figures are based on these digits. So about how to count the significant figures...
1) Every non-zero digit should be counted as one significant figure. (e.g. 72136 (5 s.f.))
2) All final zeroes after the decimal point are significant. (e.g 0.1000000 (7 s.f.))
3) The zeroes in between two significant figures are counted as significant figures (e.g 50006 (5 s.f.))
4) The zeroes which do not have a significant figure to their left are not counted as significant figures (e.g. 0.000078 (2 s.f.))
5) For whole numbers, the final zeroes may or may not be significant.
We also learnt about how to do calculations for significant figures.
For addition,
The final value has the same number of decimal places (d.p.) as the least precise measurement.
e.g.
31.5 (1 d.p) + 42.67 (2 d.p. + 53.001 (3 d.p.) = 127.2 (1 d.p)
For multiplication and division,
The final value has the same number of significant figures (s.f.) as the number with the least number of significant figures.
e.g.
46.7 (3 s.f.) * 31.78 (4 s.f.) = 1480 (3 s.f.)
56.8 (3 s.f.) / 12.745 (5 s.f.) = 4.46 (3 s.f.)
For average,
The final value has the same number of decimal places (d.p.) as the least precise measurement.
e.g.
(31.1 (1 d.p.) + 42.76 ( 2 d.p.) + 20.172 (3 d.p.)) / 3 = 31.3 (1 d.p.)
For a constant (e.g. area of triangle = 1/2 * base * height, 1/2 is the constant),
The number of decimal places (d.p.) of the constant is not considered in a calculation.
e.g.
Average = (x + y + z) / 3
(31.2 (1 d.p.) + 45.878 (3 d.p.) + 37.65 (2 d.p.)) / 3 = 38.2 (1 d.p.)
After learning about significant figures, we moved on to the experiment. The experiment was about timing the oscillations of a pendulum (made by a ball tied to a string tied to a retort stand). Basically, we let the pendulum swing for one minute and we count the number of oscillations of the pendulum and after a minute, we divide one minute by the number of oscillations made by the pendulum, to find the period, which was the time taken for the pendulum to make one oscillation. Then, we had to change the length of the string to observe the differences in the number of oscillations made per minute.
However, our teacher told us to take note of a few things.
Firstly, we had to make sure that the angle we let the pendulum go from could not be too big (around 10 degrees was preferable), or the pendulum could be extremely unstable when swinging.
Secondly, we had to watch the pendulum swinging from the front, as an oscillation is counted only when the pendulum passes the fudicial line, or the centre. From the side, we could not see whe the pendulum passes the fudicial line very well, since the centre is more easily observable fro the front.
Lastly, we had to wait for the pendulum to stabilise for a while after we let it go. We had to wait for the pendulum to make a few swings, then start the stopwatch when it crosses the fudicial line after a few swings.
So from this experiment we basically learnt the skill for measuring pendulum periods and the result of the experiment was that the longer the string was, the fewer oscillations the pendulum made in a minute.
Home-Based Learning Day
For this day (I forgot which), we were to stay at home and use the computer for, well, home-based learning. We had to log on to the iVLE portal (a portal we use for home-based learning and for some other things I do not know how to explain) and watch some videos. I would prefer going to school but well, I can't help it.
So we learnt about mass, weight, and density.
Firstly, mass is the amount of substance in an object, as we have already learnt in primary school. So, nothing much about mass I have to say.
Weight is measured by taking the mass of an object (in kg) and multiplying it by the acceleration due to gravity (approximately 10N/kg on Earth) so for example, the weight of a 10kg object on Earth is (10kg * 10N/kg)N = 100N.
Density is basically, how packed the substances in an object are.
A gravitational field is an area in which an object experiences a force due to gravitational attraction.
However, some people confuse mass with weight when this is not the case. Weight is determined by the gravitational attraction in an area whereas mass is constant regardless of gravitation attraction.
Saturday, 14 June 2014
Term 1 Week 5
Monday
For this week, we covered the units of measuring things such as length, mass, time, temperature, etc. I knew about some of these, but what was new to me was that these physical quantities or whatever you call them, have basic SI units, which are the standard units for measuring them. For example, the basic unit to measure mass is kg (not g), for length, m (not cm), for time, s (not min), etc. We also learnt completely new things, such as luminous intensity, which has cd, short for candela, as its basic SI unit, and amount of substance, which has mol, short for moles, as its basic SI unit.
We also learnt about the different magnitudes of the units. For example, 1kg is equivalent to 1000g, 1m is equivalent to 100cm. As the magnitudes are in powers of ten, this makes conversion between them much simpler than if the quotient of two units was a decimal. For example, conversion between inches and centimetres is difficult as when an inch is converted to cm, the result is a decimal. Thus, conversion between these units would often require a calculator.
Friday, 13 June 2014
Term 1 Week 4
Notice I skipped week 3. Our Science teacher was not present the whole week so there was nothing to write about...
Monday
On Monday, we re-learnt drawing graphs. However, this time, we learnt that we should make the graph as large as possible by increasing the differences between the numbers on the scale. Also, I was not used to starting a graph with a number apart from 0, so the graphs I drew did not follow what my teacher said.
We also learnt that graphs are used to show a relationship or pattern between the independent and dependent variable in an experiment so as to make a more accurate (is that the right word?) conclusion.
We then learnt about another type of graph - a curve graph. To draw this, we can either do it with a flexi ruler (bought at our school's bookshop) or free-hand (which I prefer to do).
Wednesday
This lesson, we learnt about the scientific method again and were given a worksheet to do. So... nothing much to write about I guess...
Tuesday, 4 February 2014
Week 2
Monday
In the first lesson in week 2, we were expecting a lab session (as Mr Tan told us that the lesson on Monday would be our lab session), so we went as a class to the Science Lab. However, when we arrived there, Mr Tan told us that the labs were occupied on Monday and our lab session would be on Wednesday. I was somewhat disappointed by this as I was looking forward to hands-on activities. Also, our Monday lesson is an hour and a half long while our Wednesday lesson is only an hour long. Thus, we would have half an hour less to be in the lab every week. Mr Tan also seemed slightly annoyed by this as we would have to fit one hour and a half of planned activities in the lab into the one hour session.
Mr Tan explained to us that the activity was to show us the limitations of Science. We could not see how the strings were connected from the outside as they were inside the 'pink monster', but could find out by trying out different things on the strings (pulling them). He also showed us how some pupils from another class
found out how the strings were connected by pressing on the 'pink monster' to feel the strings.
We were then shown a set of powerpoint slides on lab safety to prepare us for the lab session on Wednesday.
Tuesday
On Tuesday, we had Science lesson during what should have been English lesson, so as to make up for Mr Tan's upcoming absence on the next Monday.
We learnt about the Scientific method, which is the guideline we follow when conducting an experiment (asking a question, formulating a hypothesis, planning an experiment to find out something, making observations, and from the results, making a conclusion). We also learnt how to start the graph with a number not 0. This is to expand the space available on the graph paper for drawing out the graph. We also learnt about the best-fit line and how to draw it.
The best-fit line is a straight line which is drawn on a graph which has results that form neither a straight line nor a curve. The best-fit line is drawn to distribute equally the points above and below the line.
We also recapped on the independent, dependent and controlled variables in an experiment, and discussed about whether factors which seem like they do not affect the experiment when changed (e.g. Colour of flower pot), should be kept constant.
Wednesday
In our first Science lesson on Wednesday, we learnt about the different apparatus in the Science lab and how they are used, as well as the safety precautions (once again) we have to follow in the lab.
We then learnt how to use the spark gun to light up the bunsen burner. Afterwards, we learnt about the non-luminous and luminous flames, and how to switch in between them after lighting the bunsen burner. When the air-hole of the bunsen burner is closed, the flame that appears is the luminous flame, which flickers around unsteadily and is easily seen. However, when the air-hole is closed, the flame that appears is the non-luminous flame, which burns steadily and at a higher temperature than the luminous flame, but is not easily seen from a distance and might thus might be dangerous if a person is not careful. We also learnt about a "strike back" which is what might occur if the bunsen burner is lit up while the air-hole is open. Basically what happens during a strike back is that the flame coming out of the bunsen burner might be a little green and also gives a toxic gas which is harmful to our bodies. When this occurs, we have to turn off the gas tap immediately so as to avoid breathing in too much of the gas. If we do not do that... who knows what could happen?
In the first lesson in week 2, we were expecting a lab session (as Mr Tan told us that the lesson on Monday would be our lab session), so we went as a class to the Science Lab. However, when we arrived there, Mr Tan told us that the labs were occupied on Monday and our lab session would be on Wednesday. I was somewhat disappointed by this as I was looking forward to hands-on activities. Also, our Monday lesson is an hour and a half long while our Wednesday lesson is only an hour long. Thus, we would have half an hour less to be in the lab every week. Mr Tan also seemed slightly annoyed by this as we would have to fit one hour and a half of planned activities in the lab into the one hour session.
So instead of being at the Science lab, doing hands-on activities, we stayed in the classroom and listened to what Mr Tan had planned for us. He split us into five or six groups (can't remember) and handed each group a 'pink monster' (pink paper with strings as limbs). He told us to find out how the strings were connected by pulling the 'limbs'. He also forbade us to look inside the 'pink monster' as there would be no analysis and fun anymore. At first, our group had difficulty seeing which strings moved which as they were often taut. Therefore, after we tried out all the strings once and checked again, we realised that the results were completely different from our first try. We then made sure that the strings were all able to be pulled before actually pulling one string. After about 5 minutes of trying and failing sometimes, we finally decided that the strings were all connected together as whichever string we pulled made all the others move as well. Turns out we were right after Mr Tan revealed the answers.
Mr Tan explained to us that the activity was to show us the limitations of Science. We could not see how the strings were connected from the outside as they were inside the 'pink monster', but could find out by trying out different things on the strings (pulling them). He also showed us how some pupils from another class
found out how the strings were connected by pressing on the 'pink monster' to feel the strings.
We were then shown a set of powerpoint slides on lab safety to prepare us for the lab session on Wednesday.
Tuesday
On Tuesday, we had Science lesson during what should have been English lesson, so as to make up for Mr Tan's upcoming absence on the next Monday.
We learnt about the Scientific method, which is the guideline we follow when conducting an experiment (asking a question, formulating a hypothesis, planning an experiment to find out something, making observations, and from the results, making a conclusion). We also learnt how to start the graph with a number not 0. This is to expand the space available on the graph paper for drawing out the graph. We also learnt about the best-fit line and how to draw it.
The best-fit line is a straight line which is drawn on a graph which has results that form neither a straight line nor a curve. The best-fit line is drawn to distribute equally the points above and below the line.
We also recapped on the independent, dependent and controlled variables in an experiment, and discussed about whether factors which seem like they do not affect the experiment when changed (e.g. Colour of flower pot), should be kept constant.
Wednesday
In our first Science lesson on Wednesday, we learnt about the different apparatus in the Science lab and how they are used, as well as the safety precautions (once again) we have to follow in the lab.
We then learnt how to use the spark gun to light up the bunsen burner. Afterwards, we learnt about the non-luminous and luminous flames, and how to switch in between them after lighting the bunsen burner. When the air-hole of the bunsen burner is closed, the flame that appears is the luminous flame, which flickers around unsteadily and is easily seen. However, when the air-hole is closed, the flame that appears is the non-luminous flame, which burns steadily and at a higher temperature than the luminous flame, but is not easily seen from a distance and might thus might be dangerous if a person is not careful. We also learnt about a "strike back" which is what might occur if the bunsen burner is lit up while the air-hole is open. Basically what happens during a strike back is that the flame coming out of the bunsen burner might be a little green and also gives a toxic gas which is harmful to our bodies. When this occurs, we have to turn off the gas tap immediately so as to avoid breathing in too much of the gas. If we do not do that... who knows what could happen?
First Lesson, Week 1
Wednesday
We only had one lesson in the first week due to Orientation on the first two days.
In the one lesson in week 1, our Science teacher, Mr Tan Kok Chong, introduced himself and briefly explained what will happen during Science lessons as well as the grading system. He showed us some slides and we found out that we had to make a Science Portfolio (This blog), that would have to be constantly updated, and that it would account for 50% of our formative assessment throughout the year. At this, I was slightly surprised, as I had never done anything of such sort before and I did not know what to expect or have any idea of how I would make the Science Portfolio a job well done.
Mr Tan then showed us 2 samples which he thought were well-done blogs. They were done previously by students from Hwa Chong Institution before I entered Secondary 1. The blogs impressed me as they were detailed and also visually-appealing. I did not have much hope to make such impressive blogs as I have never used a blog before.
We were given a worksheet close to the end of the lesson about Science and Technology, as well as the attitudes a good scientist should have. The open-ended questions confused me as I was unsure of the difference between Science and Technology.
Video about machines
http://www.youtube.com/watch?v=C86pLho1hlE - The 3 idiots
This scene from the movie 'The 3 idiots' was shown to my class by Mr. Tan. It explains to us what machines are simply and in an entertaining way. It taught us to not just blindly cram definitions into our mind without understanding what some things mean as blind cramming only helps in examinations, while what we learn is expected to be used in real life and just remembering what something is from an endless stream of words would not help much when we try to recall what something we see is.
This scene from the movie 'The 3 idiots' was shown to my class by Mr. Tan. It explains to us what machines are simply and in an entertaining way. It taught us to not just blindly cram definitions into our mind without understanding what some things mean as blind cramming only helps in examinations, while what we learn is expected to be used in real life and just remembering what something is from an endless stream of words would not help much when we try to recall what something we see is.
Tuesday, 21 January 2014
Introduction
Hello, I am Ng Yu Peng from Hwa Chong Institution and I am in class 1i3 (as of 2014). This is a science blog which our class (actually the whole level) is required to keep updated frequently for the rest of the year. It will contain things we learnt in class and other stuff which we feel like posting.
Our Science teacher is Mr. Tan Kok Chong. On first impression, I felt that he was an extremely enthusiastic and cheerful teacher so I look forward to Science lessons with him.
Our Science teacher is Mr. Tan Kok Chong. On first impression, I felt that he was an extremely enthusiastic and cheerful teacher so I look forward to Science lessons with him.
Subscribe to:
Posts (Atom)